

IBDAE DIGITALE — Services
Analytics and insights
Measurement set up properly from the start, so the numbers answer questions instead of producing dashboards nobody opens. We define what counts as success before we start counting.
Start with the free diagnostic
Tell us where to reach you. Nothing else is needed yet.









- Meta
- Google Ads
- Google Analytics
- TikTok Ads
- Snapchat
- X
- Semrush
- Mailchimp
- WordPress
Dashboards nobody opens
Analytics is installed the week the site goes live and never configured again. It counts visits and a bounce rate, neither of which answers a business question, and nothing on the site is marked as a conversion. So the monthly report shows traffic, and the meeting ends with nobody able to say whether the quarter worked.
How we do it

Define success before counting anything
Which actions on your site are worth money, and roughly what each one is worth. Everything else is traffic, and traffic is not a result — it is the thing people report when they have nothing else to report.
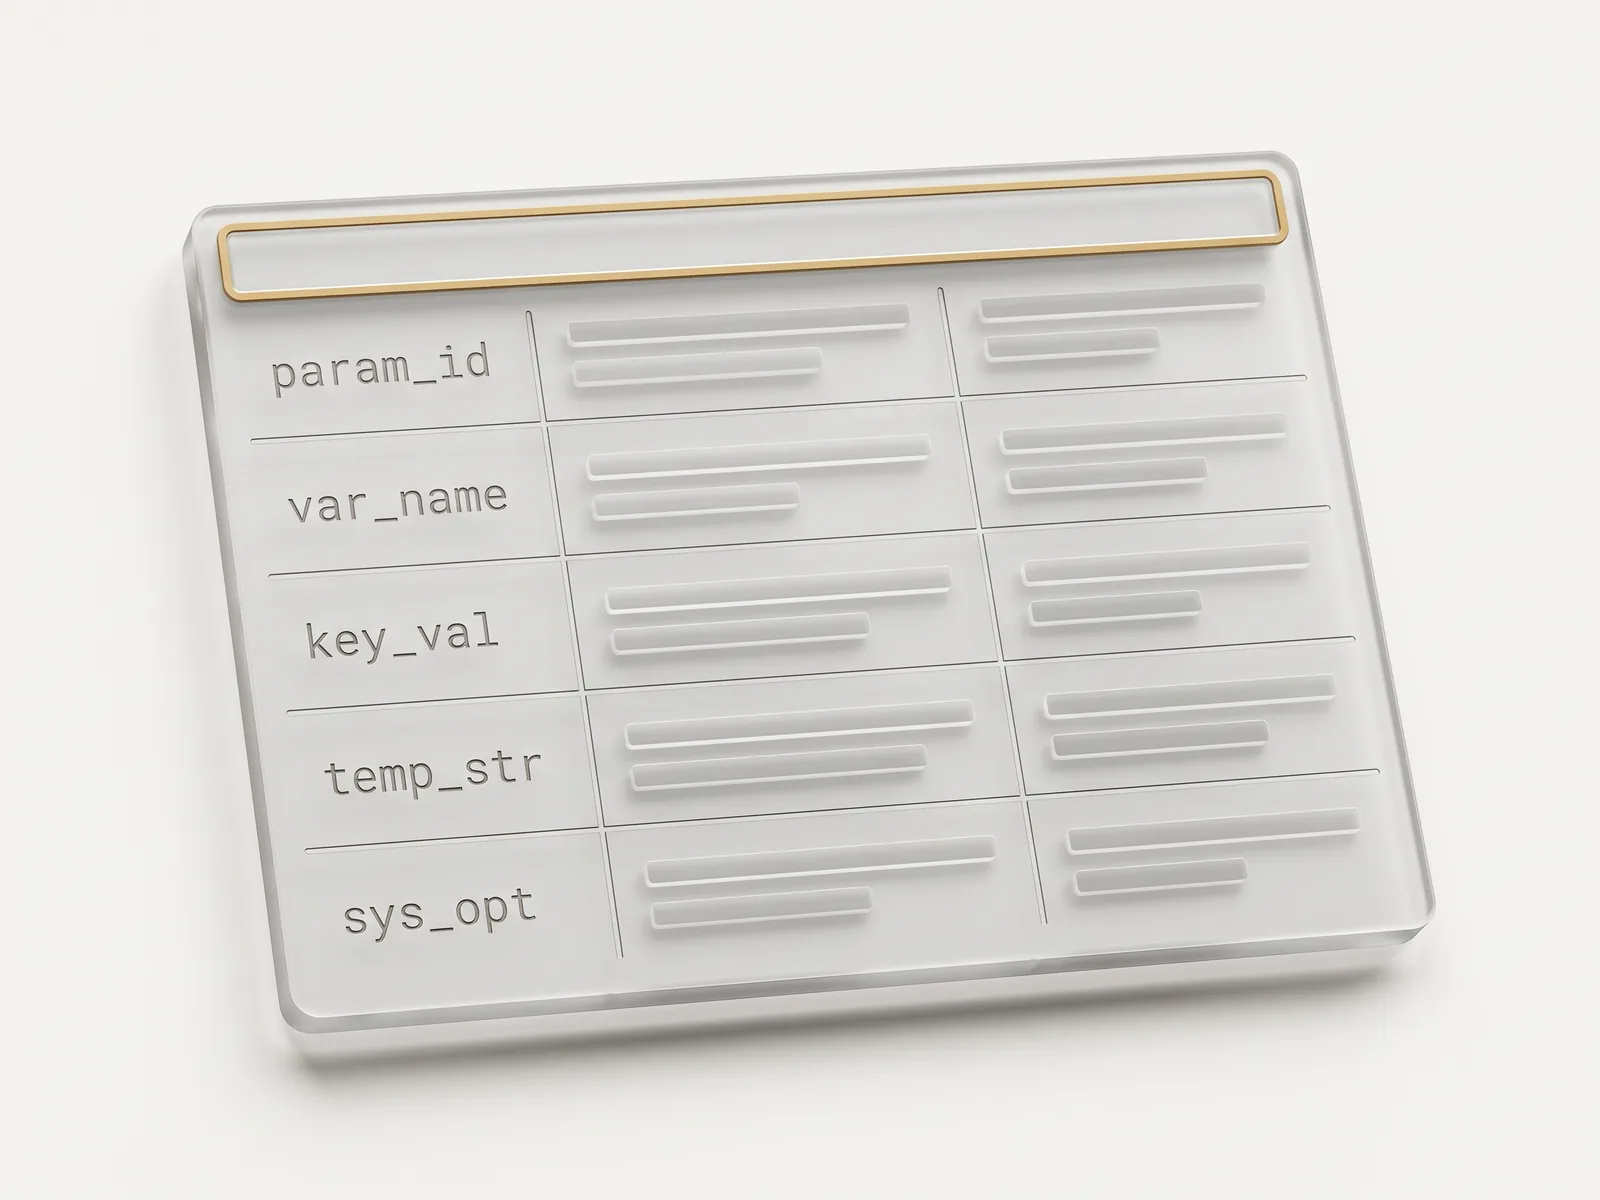
Write the tracking plan, then implement it
Events named once, consistently, and documented — so a figure means the same thing in six months, and the data does not have to be re-explained from scratch at every meeting.

Follow the drop-offs, not the averages
Where people leave, on which device, arriving from which source. The drop-off is where the money is; the average is where it hides, because an average is two different stories reported as one.

Report in sentences, not in screenshots
A monthly read of what changed, why it changed, and what should be done about it next. Exporting a dashboard and attaching it to an email is not reporting; it is forwarding the question.
What's included
- Tracking plan and implementation
- Dashboards for the metrics that matter
- Funnel and drop-off analysis
- Recommendations, not just reports
Our approach
Audit
We look at what exists first — the site, the channels, the numbers — before recommending anything new.
Strategy
One objective, the audience it concerns, and the two or three channels worth the effort. Written down and agreed.
Execution
Production and publication on a calendar you can see, with the content made to fit each channel properly.
Optimisation
Measure, keep what works, drop what does not. Reported monthly in plain language, not vanity metrics.
About this service.
I already have Google Analytics. Do I need this?
Having it installed and having it answer a question are different things. Most accounts record visits but not the one event that matters — the enquiry, the call, the order — so the numbers describe traffic and say nothing about whether the business gained anything. That gap is what this service closes.
Does measurement mean tracking my visitors personally?
No. What is needed to answer the business question is aggregate: how many, from where, and how many completed the step that counts. Measurement set up this way needs no personal profile of anyone, and it is also the version that keeps working as browsers and regulators keep narrowing what the other kind can do.
Start with the diagnostic.
A written read of what you already have — the site, the channels, the numbers — measured against what the business is trying to achieve. Three ranked priorities and a call to go through them, within five working days. Free, and yours to keep whether or not we work together.